We use the details you submit to review and respond to your project enquiry. Entries are handled in this website’s WordPress database using Fluent Forms; our hosting and email providers may process the submitted details. Other technical providers receive only the data described in our Privacy Policy.
Please do not send passwords, payment-card details, government identification numbers, sensitive personal data, or unnecessary confidential third-party information.
The greenfield runoff rate estimates how rapidly water drains from a site before development. Knowing this helps estimate the flow before development. QBAR helps establish the allowed discharge for an attenuation design. The tank holds the difference between runoff and outflow. Reducing the allowed discharge usually requires additional storage, and QBAR alone doesn’t determine a tank’s volume.
This is important for a developer analyzing quotes. Two suppliers may quote the same nominal capacity. However, they may differ in terms of their respective outlet levels or available water depths. Consider the case of the accepted discharge basis of the drainage designer. Next, assess the case of available storage. Also, consider the scope of work, installation, and other costs. The examples provided concern England, where local acceptance and connection conditions still need checking.
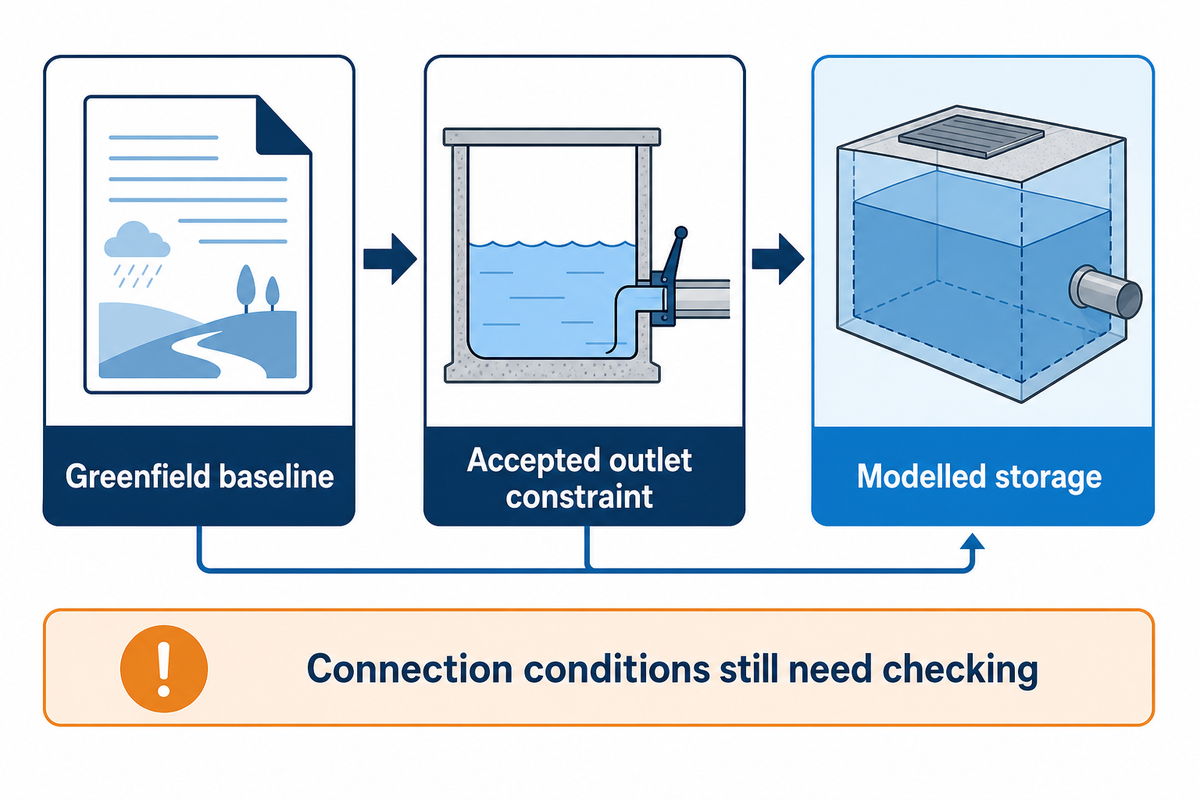
Greenfield runoff rate helps set the outlet constraint. Tank size comes from routing inflow against that outlet over time. Confirm the accepted discharge, usable storage in m³ and active water depth before requesting a tank layout.
Key design distinctions
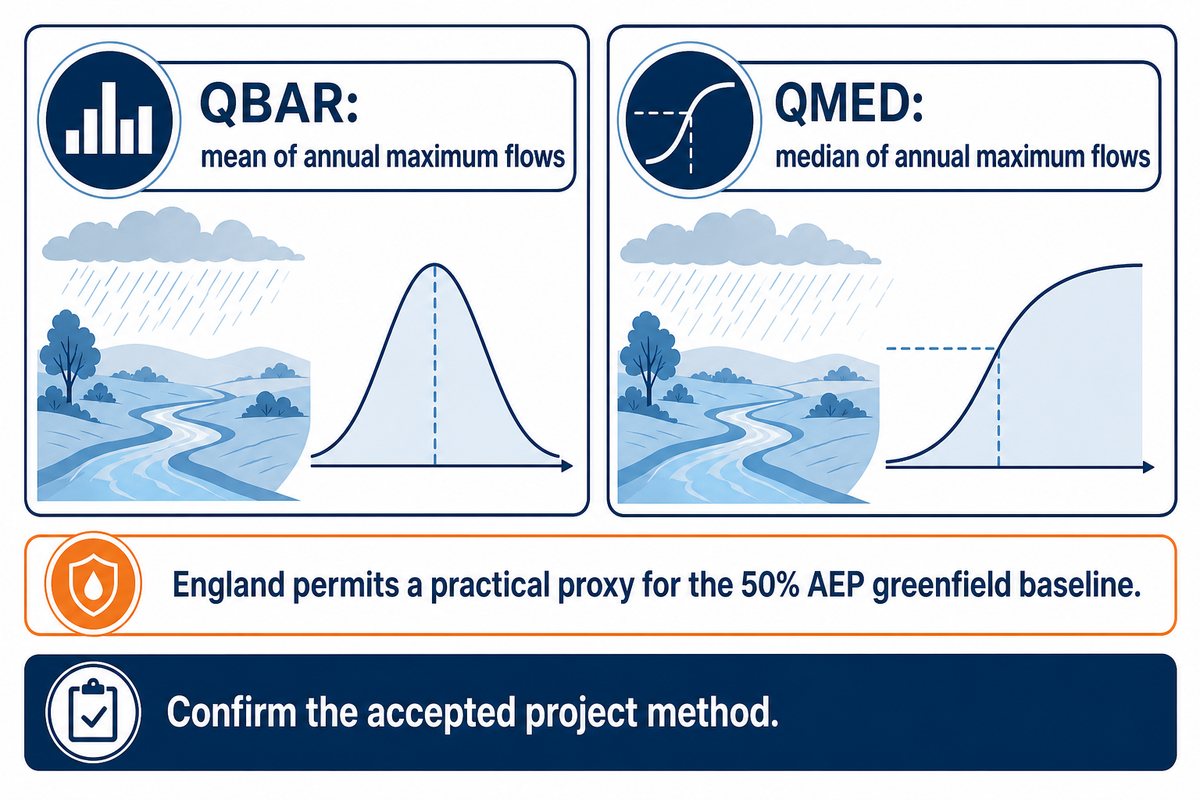
QBAR and QMED are different statistics; England permits a limited practical equivalence.
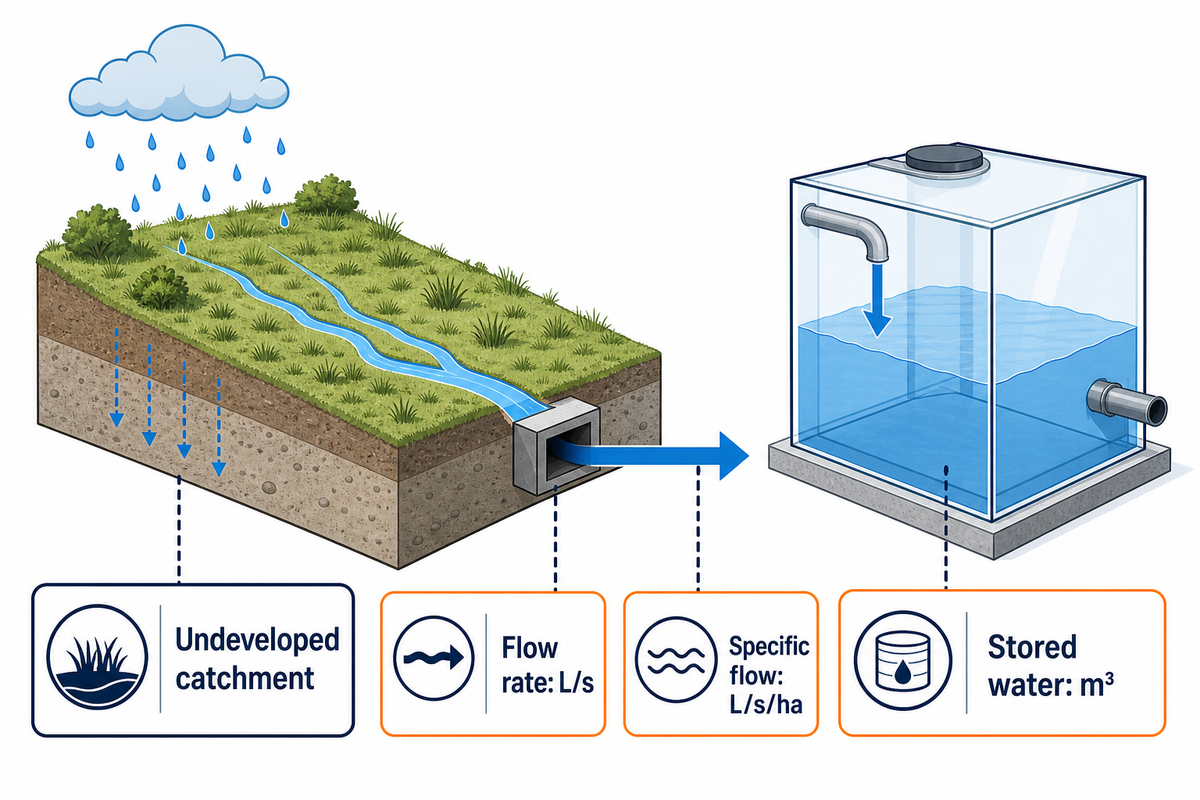
Discharge uses L/s, specific discharge uses L/s/ha, and stored water uses m³.
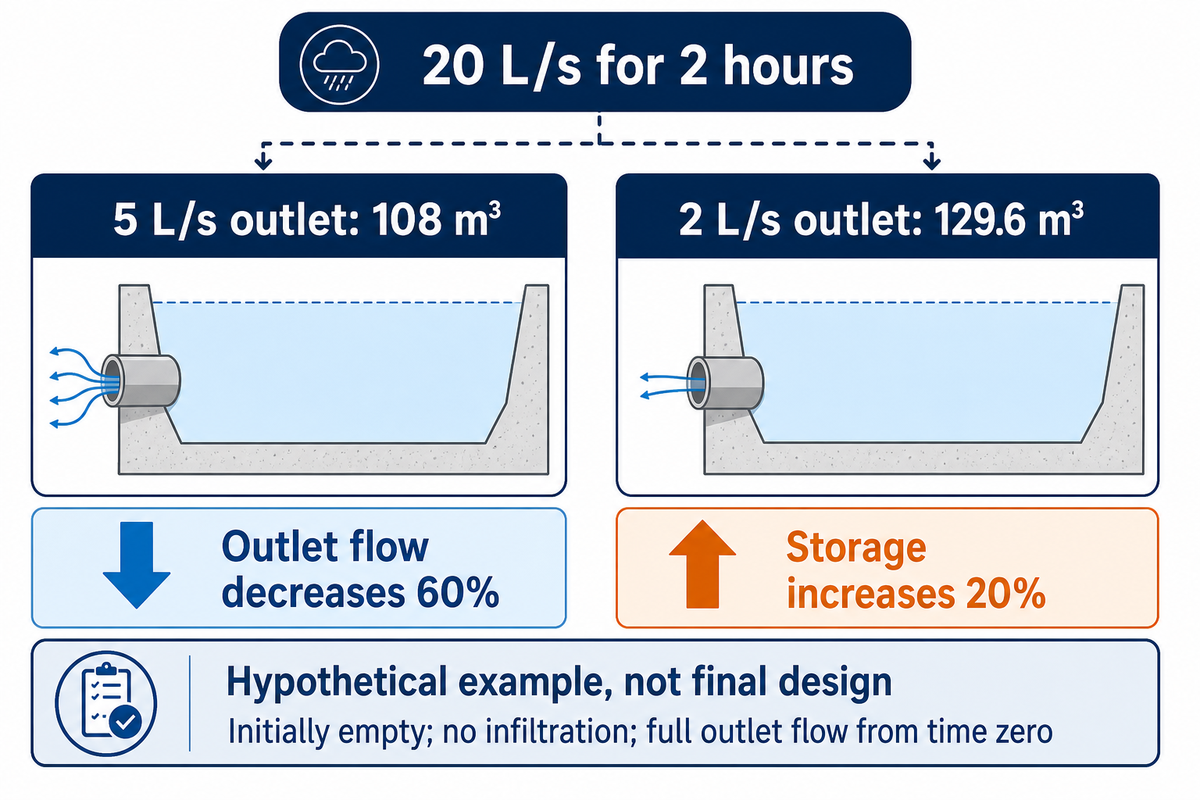
Illustration: 20 L/s inflow for 2 hours requires 108 m³ with an ideal 5 L/s outlet, or 129.6 m³ with 2 L/s.
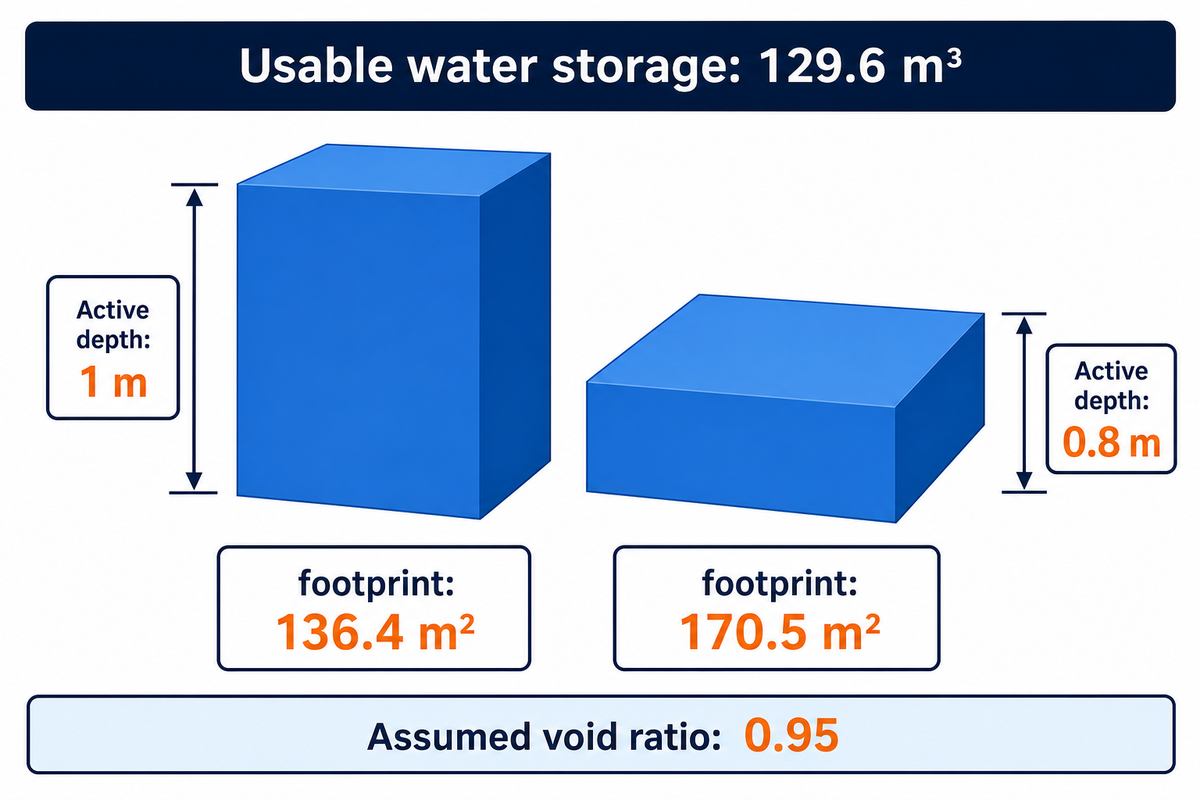
Illustrative footprint assumes 0.95 void ratio and 1 m active depth; actual geometry and outlet behaviour need verification.
What does a greenfield runoff rate measure?
Greenfield runoff estimates the undeveloped discharge of flow for a given region and frequency of rainfall. The results for the whole site are expressed in terms of discharge. A rate is expressed in discharge per hectare. These values don’t represent a storage volume. A storage volume calculation must account for the variation in runoff during the storm.
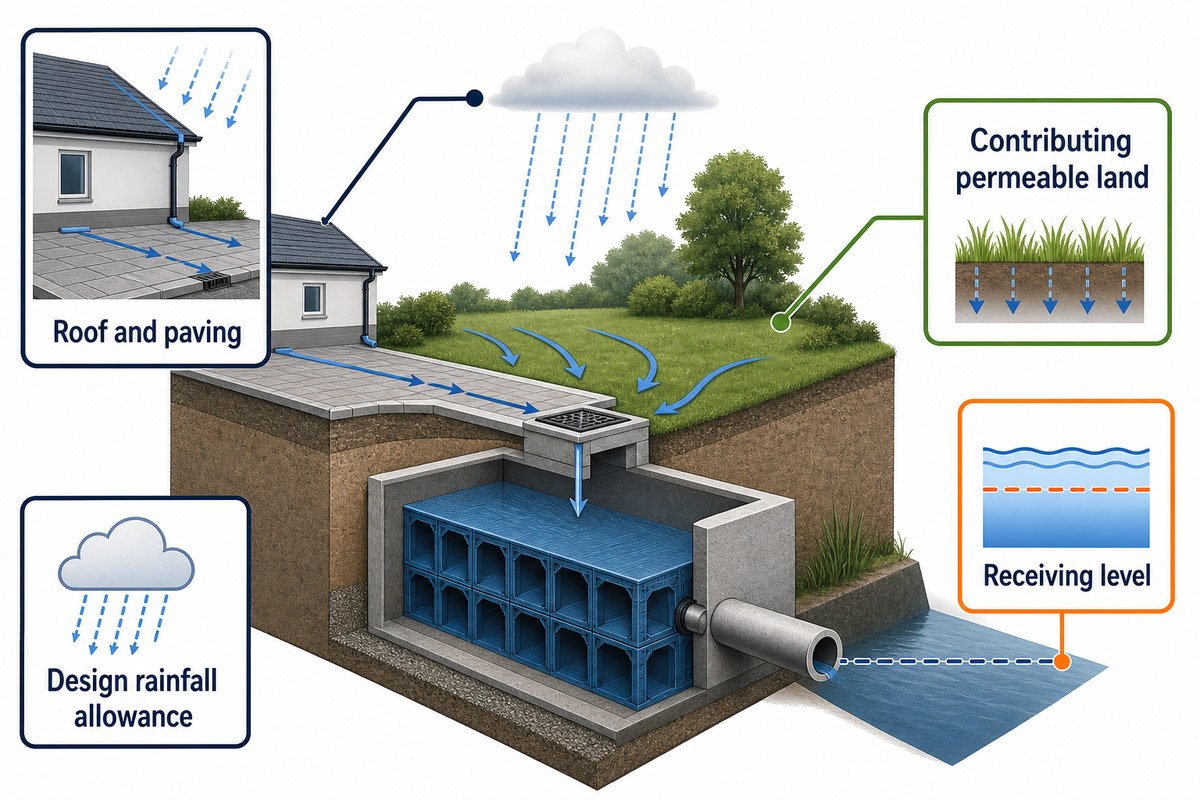
Natural drainage spreads rainfall between infiltration, evaporation and surface flow. Roofs and paving change that response. An attenuation tank for controlled stormwater discharge temporarily stores some of the resulting runoff, while an outlet releases water under the agreed conditions. Storage delays discharge; it doesn’t necessarily remove that water from the catchment.
Take a look at the units on a report. Let’s use units of measure to illustrate. If we assume a specific flow of 2 L/s/ha over 0.8 ha, the flow rate becomes 1.6 L/s. This example doesn’t derive the permissible rate of an English development. The report must state the area of the land region, the method and the event related to the outcome.
Common mistake: A common error is to send potential suppliers a QBAR of 2 without a unit or area. Prices based on 2 L/s for the entire site may be quite different from prices based on 2 L/s/ha. Ambiguity should be resolved before the module selection stage to avoid surprises at the layout pricing stage.
Reporting 2 L/s/ha requires a contributing area to show complete site flow. Considering an example area of 0.8 ha, flow will be 1.6 L/s. Quotations for the tanks require the separate routed storage volume, the levels of the outlets, and the water levels.
QBAR versus QMED: choose the greenfield calculation method
QBAR is the mean of annual maximum flows, and QMED is the median of annual maximum flows. Both of these parameters describe different summaries of a catchment’s flood behavior. According to England’s national standard, it’s permitted to use either the QBAR or QMED value as a surrogate to define the 50% annual exceedance probability greenfield flow; however, the acceptance of the method for the project still needs checking.
The UKSuDS greenfield estimation guidance explains the IH124 and Flood Estimation Handbook approaches and their limitations on small sites. The equations derive from catchment evidence. Applying them to a development produces a planning estimate, not a measurement of the site’s actual peak flow.
Agree the method and lead local flood authority (LLFA) requirements with the approving body before buying data or carrying an old calculation into detailed design. For example, Arun’s local drainage guidance expects the FEH statistical method and limits its acceptance of IH124 to specified planning circumstances before 19 June 2025. That’s a local example, not a rule for every UK authority.
Check the method: On the calculation sheet, specify the software version, method, dataset(s), soil descriptors and area units. FEH22 rainfall and the FEH 2025 statistical method are different inputs to the wider assessment. Mixing versions of these inputs may change the outcome of the estimate even when the site boundary remains the same. When evaluating the quotation, redesign risk exists when an assumed Statistical Method remains unaccepted. The acceptance criteria should be documented, as changes to the greenfield rate may alter the hydraulic model and cause the priced layout to be deemed invalid.
Set the permitted discharge before sizing storage
Permitted discharge represents outlet constraints in hydraulic models, and is specific to the project at hand. England’s national standards compare greenfield flows with a specific rate of 3 L/s/ha, using different conditions for the 50% and 1% annual exceedance probability events. The comparison uses different conditions for the 50% and 1% annual exceedance probability events. Local requirements, and the receiving connection, also affect the level of discharge.
For the 50% annual exceedance probability event, compare the equivalent greenfield flow with 3 L/s/ha and use the greater value as the national peak limit.
For the 1% event, first compare the runoff volume discharged from the development to surface waters or sewers with the greenfield runoff volume for the 1% event of six hours.
If that discharged volume is greater, the national peak limit uses the 50% greenfield flow or 3 L/s/ha, whichever is greater. If volume is no greater, it uses the 1% greenfield flow or 3 L/s/ha, whichever is greater.
Ensure both sides of a comparison are reflected on an equivalent area basis. Account for justified interception and infiltration reductions when comparing discharged volumes. In accordance with standard 3.27, a QBAR/QMED proxy may be utilized to establish a 50% baseline; however, the requirement to perform a volume test isn’t waived. More restrictive locally supported controls, in accordance with standard 3.10, take precedence.
Imagine a purchaser who has received a tank price before the outlet has been determined. One drawing shows the control as “5 L/s”, while the drainage drawing shows it as “2 L/s”. The tank in question may not be able to provide the required storage at the water level. Reducing the outlet to 2 L/s won’t by itself resolve the issue as it will also impact the amount of water retained during the storm and recovery afterwards. Ask the designer to redo the model. Provide the revised storage and levels to all bidders. Comparison of bids will only be useful when all bidders have priced the same revised storage and levels. The two values of outlet shown here illustrate variation. Neither of these represents a default design value.
The specific limit of 3 L/s/ha isn’t an absolute permission to discharge 3 L/s from every plot. For an assumed 0.8 ha area it corresponds to 2.4 L/s before applying the appropriate comparison and project conditions. This comparative analysis will need to remain separate from the discharge approval.
Define the site area and design storm inputs
A discharge calculation must establish the contributing area, design rainfall and receiving levels; the previous 2.4 L/s example doesn’t establish an allowed discharge.
The land that can contribute runoff will need to be included in the design, including permeable areas during extreme events. This design will need to consider limits on the receiving levels. Appropriate climate allowances for design rainfalls will be considered in the design. The greenfield baseline is calculated without that climate uplift.
Roof-only estimates may underestimate runoff from saturated landscaping and/or other connected surfaces. Identify the catchment limit in the survey and drainage plan. Depending on the evidence, infiltration may reduce the volume of runoff requiring discharge; our infiltration versus attenuation guide provides information on the temporary detention option and disposal to the ground.
“different critical durations may apply to different storage features used on a development.”
The explanation of the UKsuds storage-method covers hydraulic routing and a search across storm duration. Longer events may govern storage while shorter intense events may govern pipeline flows, so critical duration can differ. Model tailwater too: its effect on outflow should be applied when modeling stored water. A surcharged receiving pipeline may reduce outflow during the event while the tank stores water.
England’s standard 2 addresses retaining the first 5 mm for the majority of events through use, infiltration or loss to soil and atmosphere. The system needs mechanisms to retain the first 5 mm of water for the majority of events and must consider water quality, biodiversity and amenity.
In a system, the interception and detention functions of each design element need to be considered separately. Meeting the first 5 mm objective can’t be inferred from a large sealed tank, and an assumed 2-hour storm can’t establish the critical storage event. Always consider the complete drainage in detail before reaching conclusions and assuming a design element may fulfill the function of a storage solution.
Worked example: discharge limits and attenuation storage
The largest accumulated difference between inflow and outflow during the simulated event, allowing for other justified losses, is referred to as required attenuation storage. It shows stored water, not outlet losses. An example with a constant outflow illustrates that a percentage reduction in outlet rate doesn’t always result in an equal percentage increase in tank size. Actual design requires variable inflow and outflow and the hydraulic response of the outlet.
Picture an empty store for now. Let’s say it receives 20 Liters/second for 2 hours, which equals 7,200 seconds. For now, let’s also ignore infiltration. In this example, the outlet has full stated flow and lets the water through from the beginning of the storm. Incoming water is 20 × 7,200 ÷ 1,000 = 144 m³. At 5 L/s, the outlet removes 36 m³ over that period, leaving a peak of 108 m³. At 2 L/s, it removes 14.4 m³, leaving 129.6 m³. Decreasing the outlet by 60% increases storage by 21.6 m³, which is 20% in this example. These assumptions don’t give us a universal 20% for a different site.
Discharge-to-Footprint Sensitivity Table
Each line of the table assumes constant inflow and duration of rainfall. Footprint additionally assumes a 0.95 usable void ratio and 1 m active water depth. Values shown are rounded after calculation.
Ideal constant outlet
Water retained
Illustrative footprint
Limitations / Not suitable for
0 L/s
144.0 m³
151.6 m²
No discharge during the 2-hour event; separate emptying route needed
1 L/s
136.8 m³
144.0 m²
Full 1 L/s from time zero is an idealisation
2 L/s
129.6 m³
136.4 m²
Not a default permitted rate
3 L/s
122.4 m³
128.8 m²
3 L/s whole-site flow is different from 3 L/s/ha
4 L/s
115.2 m³
121.3 m²
Changing tailwater invalidates constant outflow
5 L/s
108.0 m³
113.7 m²
Not a universal minimum outlet allowance
6 L/s
100.8 m³
106.1 m²
Critical duration may exceed 2 hours
7 L/s
93.6 m³
98.5 m²
Requires project-specific outlet acceptance
8 L/s
86.4 m³
90.9 m²
No allowance for water remaining from an earlier storm
A real-world outlet typically relies on water head. An outlet rated at 5 L/s at its design head can allow less flow when the water head is lower. The constant outlet formula can underestimate storage. In this case, it doesn’t provide a conservative upper bound. Before each succeeding storm, check residual water and the drawdown. Also consider the maximum stored volume of a single event. Refer to national standard 3.22 for assessment and mitigation of potential blockages, with suitable protection of orifices smaller than 50 mm.
Holding a 20 L/s inflow for 2 hours, the ideal example rises from 108 m³ to 129.6 m³ when outflow falls from 5 L/s to 2 L/s. The 20% gain demonstrates sensitivity. The 20% increase demonstrates sensitivity, while the approved tank volume must come from the project’s hydraulic model.
Convert usable storage into tank footprint
Usable storage volume, effective void ratio and active water depth determine the footprint of the tank. To determine the footprint of a uniform rectangular tank, divide usable water volume by the void ratio and active water depth. For attenuation tanks, determine the location of the outlet and the maximum depth of water, because a nominal volume of the tank cannot alone determine the layout of the tank.
For a geocellular attenuation tank, using the illustrative 129.6 m³ requirement, a 0.95 void ratio and 1 m active depth gives 129.6 ÷ (0.95 × 1) = 136.4 m² before module rounding. A 0.8 m active depth case gives an effective area of 170.5 m². These checks are geometrical and don’t consider excavation limits and/or structural approval.
Imagine a site team with a fixed elevation of the finished surface. A lower module footprint wouldn’t necessarily represent a smaller excavation. However, if the outlet isn’t deep enough, some of the space for stored water wouldn’t be usable during the design event. The designer must determine if the lower water storage volume would be available during the design event. When comparing modules, the designer and contractor should consider working clearances, bedding, cover and space for connections. These spaces should not be considered usable water storage. This doesn’t mean that a smaller module would be able to be installed without difficulty in the available location.
For further design and construction of the tank, provide anticipated fill and drawdown levels, and describe the hydraulic and structural loading conditions for attenuation tank installation. Proposals should define and identify dead volumes and access ways and describe how these affect usable storage. Prices shouldn’t be compared based on nominal volume without those deductions.
At a void ratio of 0.95, lowering the active water depth from 1 m to 0.8 m increases the expected footprint from 136.4 m² to 170.5 m² with 129.6 m³ of liquid. While the footprint of the tank increases by 25% from this illustrative design, the remaining space for bedding, cover, construction and clearance must be checked before accommodating the increase.
Engineer-to-Supplier Design Handover
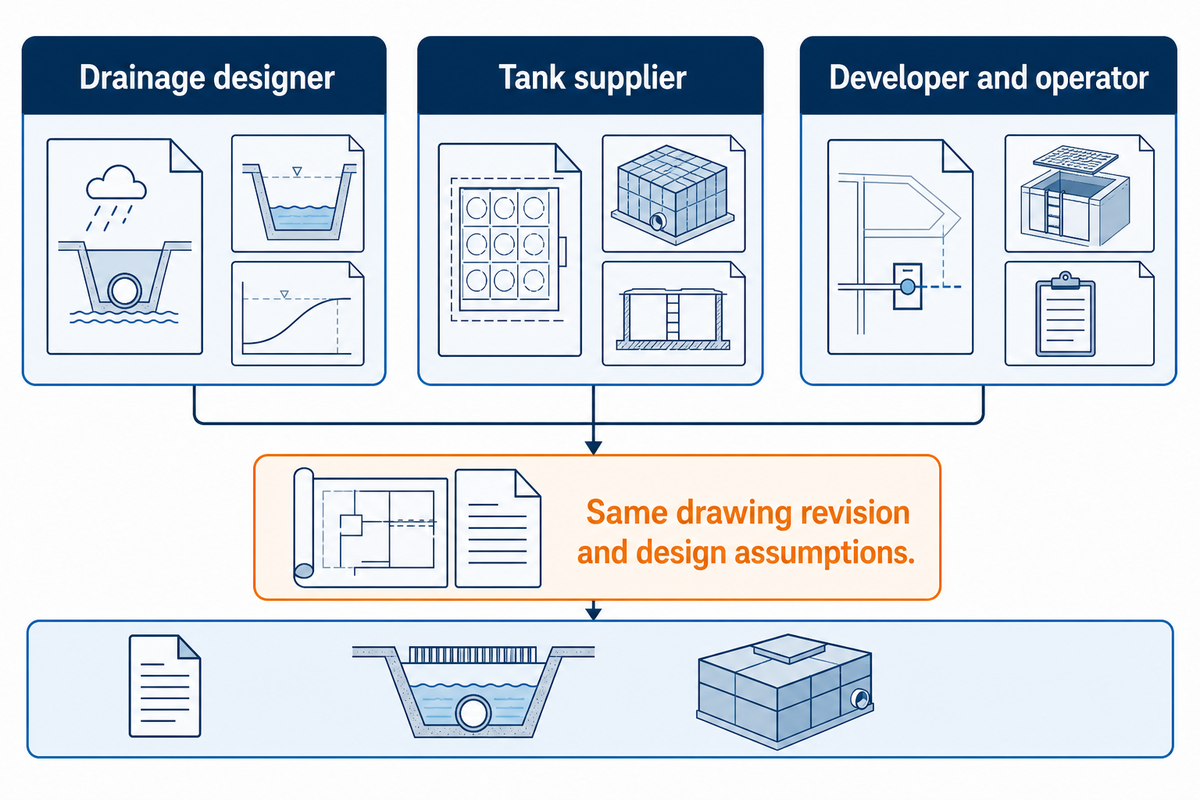
The handover from engineer to supplier defines the approved tank hydraulics. Identify the owner and revision of each input and state what would require the designer to recalculate. Purchasing, construction and operating agents can check exclusions, installation and access respectively. Check the positioning of product access and controls prior to fixing the order.
This matrix will help you classify changes. The responsibility column shows a potential project assignment to discuss at the next meeting and confirm in the appointment, and doesn’t suggest a supplier automatically bears design responsibility. Other related submission documents are found in the design-suds Supporting Documents guide.
Input class
Owner to confirm
Handover evidence
Limitations / Not suitable for
Discharge permission
Developer and drainage designer
Accepted L/s, event basis and connection conditions
A calculated baseline alone does not establish a right to connect
Catchment boundary
Drainage designer
Survey and contributing ha by surface
A revised contributing area needs model review
Rainfall and method
Drainage designer
Dataset and software revisions; climate allowance basis
Do not combine old descriptors with a new equation
Outlet behaviour
Control supplier and designer
Head-discharge curve, tailwater, control opening and blockage protection
A maximum L/s value omits head changes; assess blockage risk for every control
Storage and recovery
Drainage designer
Peak m³, critical duration and drawdown results
Initially empty modelling may miss residual storage
Active levels
Designer and tank supplier
Inverts, maximum water level and usable depth in m
External height is not automatically active depth
Structural installation
Appointed structural/geotechnical designer
Load case, cover and groundwater design basis
Hydraulic capacity does not demonstrate load resistance
Operation and access
Developer and future operator
Inspection, sediment control and maintenance arrangement
Unreachable controls undermine maintenance plans
Commercial scope
Procurement and contractor
Bill of quantities with exclusions and drawing revision
Tank-only prices exclude some installed costs
For the receiving connection, planning calculations and land rights are separate. Leeds’ guidance on discharge points, for example, asks for written agreement where offsite pipes and privately owned receiving systems are involved. Confirm the applicable requirements for the actual location.
When not to order the tank yet
Copy these fields into the quote request after the design inputs are agreed:
Parameter
Recommended range
Why it matters
How to verify
Discharge
Project-approved L/s for each event
Sets the control constraint
Accepted report and outlet curve
Usable water storage
At least the required routed m³
Avoids buying nominal empty space
Volume between operating levels
Active depth
Project-specific m; not external module height
Determines usable capacity and footprint
Section drawing with datum
Cover and load
Within the selected system’s verified installation limits
Connects product choice to site loading
Project structural calculation
Control opening
Design-selected mm with blockage protection
Low-flow performance needs maintainability
Control specification and maintenance plan
Hold the product order when the outlet rate is still provisional, the quoted volume includes unavailable storage, or the receiving level hasn’t been considered. An installed attenuation tank cost comparison should use matching design assumptions. Buying extra modules doesn’t resolve an inaccessible control or an unapproved connection.
Let’s say there are two bids, each for 130 m³. The first of the two defines capacity between the working levels, and includes the control chamber. The second uses the module’s nominal capacity, and doesn’t include control. Financial analysis may focus on the lower headline price figure. The contractor, however, has to deal with the missing chamber, and potentially, a larger excavation. Request the two service providers to price the same volume, working levels, and scope of service. If the designer changes those parameters, the same change and revision must be sent to both suppliers and the client.
Following the designer’s resolution of hydraulic and structural queries, request a detailed product layout against that information, and clarify each supplier’s services and exclusions in the quotations. If the evidence isn’t available, conditional quotations can be provided to assist in the preparation of a preliminary budget. However, such quotations shouldn’t be considered as approvals for the work.
What changed in 2025 for greenfield runoff estimates?
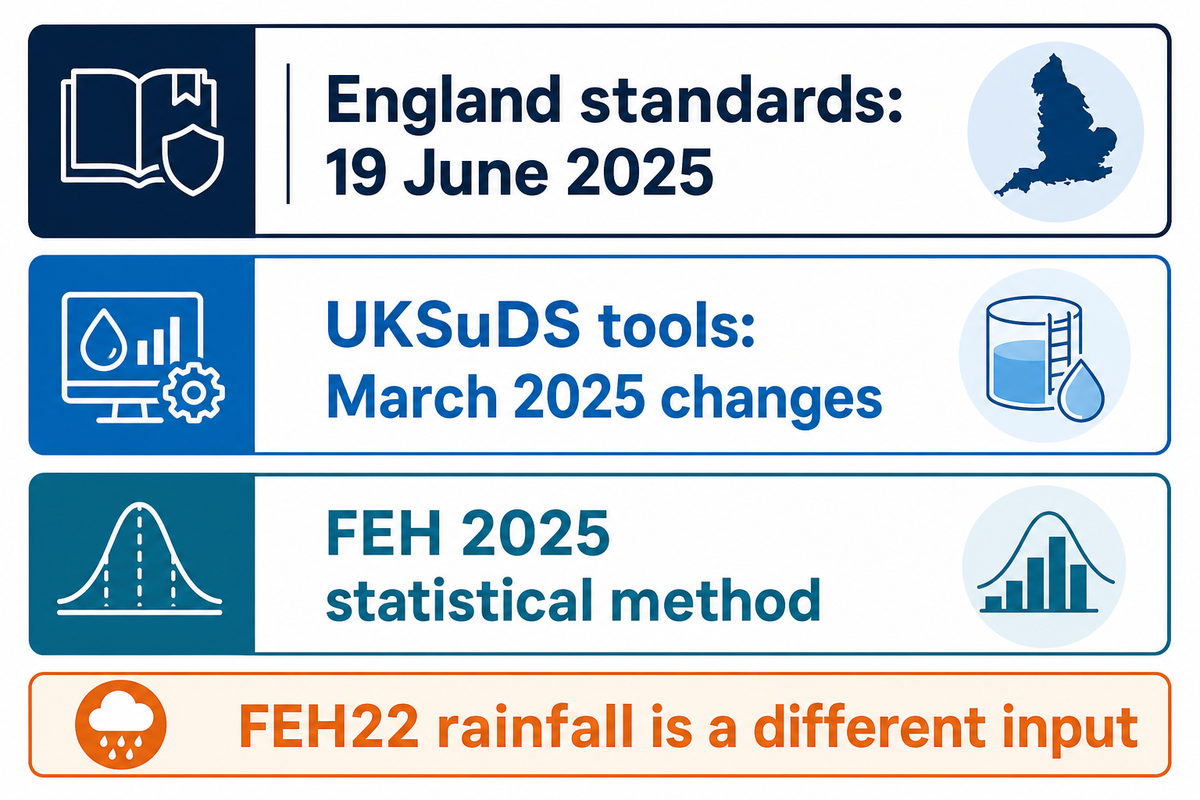
There have been several notable updates in 2025. As such, it’s prudent to implement version control on certain assessments. Three separate 2025 changes make version control important: England published new national SuDS standards, UKSuDS updated its estimation tools, and the FEH statistical method changed. FEH has also updated its statistical methods. While older estimations of QBAR may still be used to inform a planning decision, it should be ensured that the methods and scope reflect those accepted by the authority.
The first publication date of the 2025 edition in the government publication record for non-statutory standards is 19 June 2025. These most recent revisions (30 July) linked to the previous version of the standards. These aren’t a new set of standards. These standards outline requirements for England within the wider planning and approval processes.
UKSuDS describes March 2025 changes to its storage tool, including explicit modelling of grassland runoff and hydraulic routing. Separately, the UK Centre for Ecology & Hydrology’s FEH update covers the 2025 statistical method, including QMED and associated adjustments. Naming the software alone leaves these choices unclear.
It’s a procurement risk to procure outdated inputs, as suppliers may charge based on the wrong usable capacity. Keep the revision sheet along with the calculation report, accepted discharge, rainfall data, and descriptors of the site soil, as well as the authority’s response. Local resources, such as the Essex Design Guide, are helpful in providing context, but their date and application need checking alongside the national guidance. Changing the methodology of the calculation is a valid reason for review. Not all changes to calculations require a larger storage capacity.
If an earlier quotation assumed 108 m³ and the approved model now requires 129.6 m³, identify the changed inputs before ordering the additional 21.6 m³. What are the changed inputs justifying the additional 21.6 m³? An increase in rainfall or a change in the outlet constraints may warrant an increase in the usable capacity. A usable-depth change can also alter the layout; the numerical difference alone cannot identify which component needs redesign.
Send Storm Manage the designer’s discharge basis, required storage, operating levels and tank installation constraints through our form. Hydraulic acceptance and the designer’s responsibilities must be clear.
Frequently asked questions
What is the greenfield runoff rate?
The greenfield runoff rate estimates flow from undeveloped land for a defined rainfall frequency, expressed for the whole site in L/s or as a specific rate in L/s/ha.
The greenfield runoff rate estimates the flow from land in its undeveloped condition for a defined rainfall frequency. It may be reported for the whole site in L/s or per hectare in L/s/ha. Designers use the baseline when establishing discharge controls, but the permitted outlet and required attenuation volume also depend on the applicable policy, contributing area and hydraulic model.
How is the storage volume calculated?
A hydraulic model tracks water entering and leaving the drainage system over time, then finds the maximum stored volume across the required events and durations.
A hydraulic model tracks water entering and leaving the drainage system over time, then finds the maximum stored volume across the required events and durations. Inputs include runoff from contributing surfaces, rainfall allowances, outlet behaviour, receiving levels and any justified infiltration. A calculation using constant inflow minus constant outflow explains the principle but can’t replace routing when those flows change during a storm.
What storm return period should I design for?
Design storm selection follows the approving body and applicable guidance, with annual exceedance probability, critical duration, climate allowance and safe exceedance arrangements all stated in the design submission.
Use the events required by the approving body and the applicable drainage guidance. England’s national standards include checks associated with 50%, 3.3% and 1% annual exceedance probabilities, with different performance objectives. Critical duration must also be found; choosing a return period alone doesn’t establish storage. The designer should identify climate allowances and safe exceedance arrangements in the submission.
Is QBAR the same as QMED?
QBAR describes the mean annual maximum flow and QMED the median annual maximum; England permits limited practical equivalence when establishing the 50% annual exceedance probability greenfield baseline.
No. QBAR is a mean annual maximum flow and QMED is the median annual maximum. England’s standard 3.27 permits either as a practical proxy for the 50% annual exceedance probability greenfield flow.
Does a smaller discharge always mean a bigger tank?
Reducing discharge generally increases peak storage when inflow and other assumptions stay fixed, but changes to infiltration, source controls, rainfall or contributing area require comparison of complete model runs.
With the same inflow, usable depth and other assumptions, reducing outflow generally increases peak storage. Changing infiltration, source controls, rainfall assumptions or contributing area can change that comparison. Compare complete model runs.